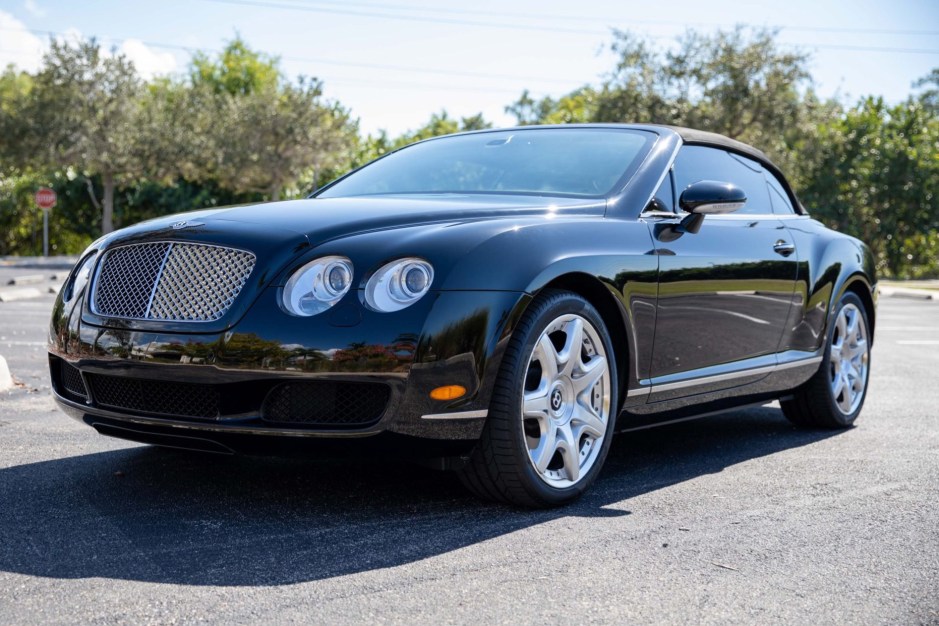
This 2008 Bentley Continental GTC was optioned with the Mulliner Driving Specification and has been registered in Florida since new. Finished in Beluga over Ochre leather upholstery, the car is powered by a twin-turbocharged 6. 0-liter W12 linked with a six-speed automatic transaxle, an all-wheel-drive system, and a Torsen center differential. Additional equipment includes 20″ seven-spoke alloy wheels, adaptive air suspension, a power-retractable black soft top, xenon headlights, parking sensors, a rearview camera, heated front seats, navigation, a 12-speaker audio system, multi-zone automatic climate control, and cruise control. Work in 2025 consisted of changing the oil and replacing the shifter trim, batteries, front struts, and top actuators, and the seller purchased the car in August of that year. This Continental GTC has 9k miles and is offered with a build sheet, owner’s manuals, service records, a clean Carfax report, and a clean Florida title in the seller’s name.